Short answer
NDVI is an index calculated from the light a crop reflects in red and near-infrared. It is turned into a colour map that shows where vegetation differs inside the same field. It does not diagnose disease, nutrient deficiency or water stress: it shows where it is worth going to take a closer look. When the check in the field shows there is a reason, the same map can become the basis for a prescription map.
We see the field differently, with the help of technology
A field can look uniform from the ground, but the picture changes when we look at it from above with the right tools.
In some places plants may grow more vigorously, while in others they may grow less or behave differently. These differences are not always easy to spot by eye, especially over large areas.
This is where precision agriculture, and in particular multispectral imaging with a drone, comes in. One of its most important tools is the NDVI index, which helps us capture and compare the relative condition of vegetation at different points of a field.
But what exactly is NDVI? What can we understand from a map and, above all, how can it help in practice?
1. What is NDVI?
NDVI stands for Normalized Difference Vegetation Index. It is calculated from the light reflected by the crop surface in two regions of the spectrum:
- Red light (Red)
- Near-infrared (NIR), light the human eye cannot see.
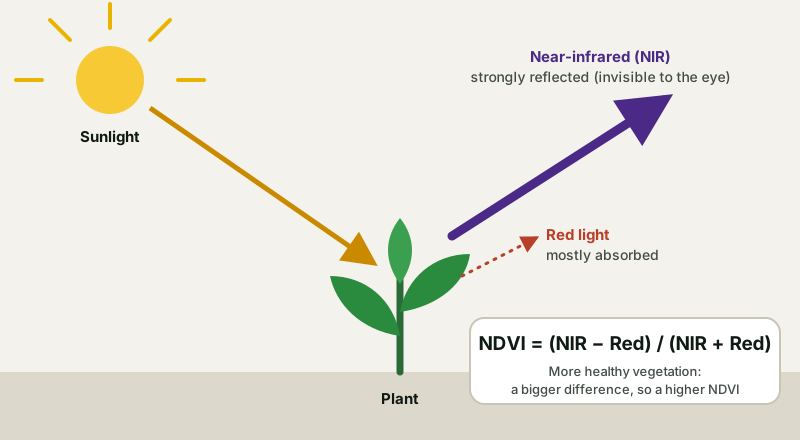
The chlorophyll in leaves absorbs a large part of visible light, while the internal structure of the leaf strongly reflects near-infrared. The denser and more developed the green vegetation, the bigger the difference between the two. The formula is:
NDVI = (NIR − Red) / (NIR + Red)
Its values range theoretically from −1 to +1.
For a general picture, NASA gives these indicative values for the land surface:
| NDVI value | What it usually corresponds to |
|---|---|
| 0.1 and below | Bare ground, rock, sand or snow (over water the values are usually negative) |
| 0.2 to 0.3 | Shrubland and grassland |
| 0.6 to 0.8 | Dense, healthy vegetation |
Important
NDVI is not, by itself, a diagnosis of disease, nutrient deficiency or water stress. It shows where it is worth looking at the crop more carefully. The values in the table are general, and no single value marks every crop as healthy or problematic.
2. How do we read an NDVI map?
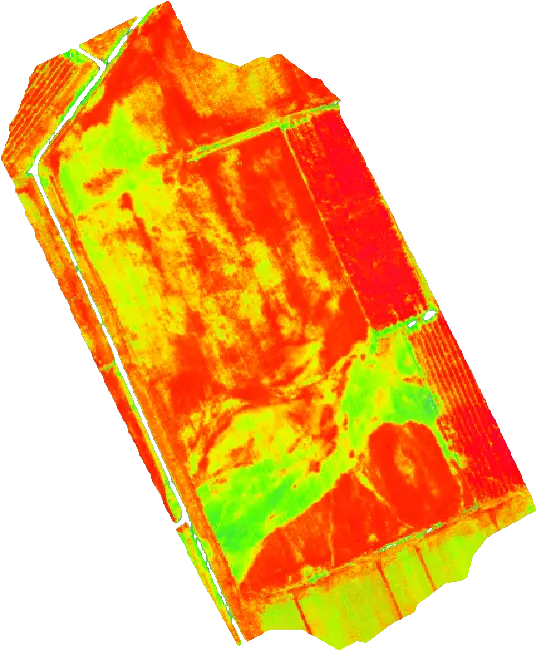
An NDVI map turns the numerical values of the index into a colour display, so that differences inside the field are easier to spot. Usually green shades correspond to higher values and yellow or red to lower ones. The exact mapping depends on the scale the software uses, so always look at the legend of the map.
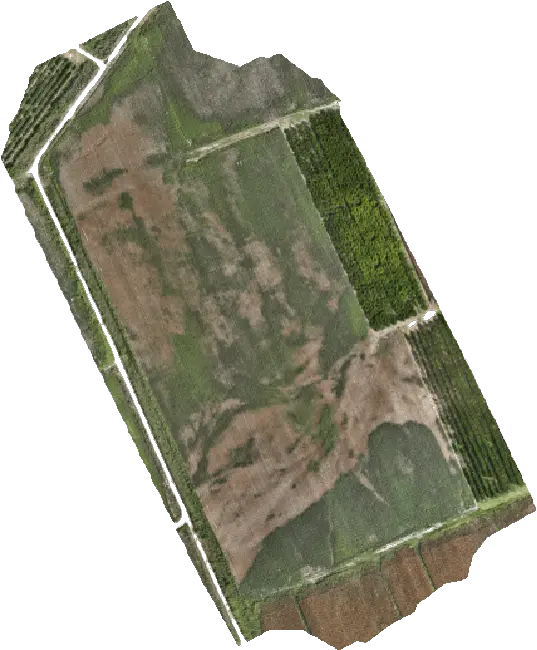
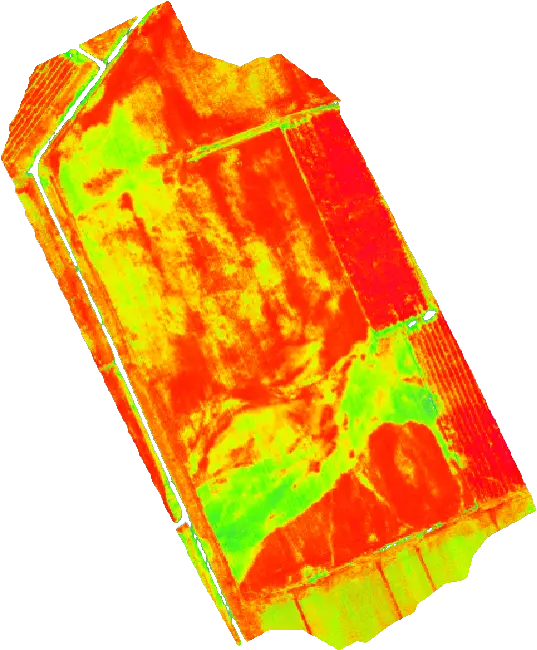
The photo clearly shows the boundaries, the trees and the soil. The NDVI map shows differences in vegetation that the photo does not show as easily, such as zones of stronger and weaker growth inside the same field.
What can the different areas mean?
- Areas with higher NDVI values: they may correspond to denser or more developed vegetation. The interpretation depends on the crop and its growth stage.
- Areas with lower NDVI values: they may indicate sparser vegetation, a different growth stage, gaps in the crop or possible stress. In some cases the image is affected by bare soil or other factors.
- Areas with strong differences inside the same field: fields where the map shows unevenness are of particular interest. It may be worth checking different spots, comparing with earlier measurements and investigating possible causes.
The interpretation must take into account the crop, the growth stage, the conditions in the field and the date of capture.

3. How is a field imaged with a drone?
Multispectral mapping uses special sensors that record information an ordinary photo cannot. A typical example is the DJI Mavic 3 Multispectral, which combines a conventional RGB camera with multispectral sensors. It is the drone we use for our multispectral imaging service.
| Mavic 3 Multispectral | Details (DJI) |
|---|---|
| RGB camera | 20 MP, 4/3 CMOS sensor |
| Multispectral camera | 4 × 5 MP, in 4 spectral bands: green (560 nm), red (650 nm), red edge (730 nm), near-infrared (860 nm) |
| Light sensor | Built in, so the difference in lighting between shots can be corrected during processing |
| Positioning | RTK module with horizontal accuracy of 1 cm + 1 ppm |
| Flight | Up to 43 minutes in no wind and up to 200 hectares per flight, according to DJI |
The red and near-infrared bands are the ones NDVI needs. The other two give additional indices: besides NDVI, the DJI Terra software produces indices such as GNDVI, NDRE, OSAVI and LCI. For the position of the data see also the article What is RTK in farming.
The stages of multispectral imaging
- Defining the field. The area to be mapped is identified, taking into account the crop, the size and the purpose of the analysis.
- Flight and data collection. The drone flies a programmed mission and collects images from the right sensors. The quality and consistency of the data depend, among other things, on the flight plan and the capture conditions, especially the lighting.
- Processing the images. The data are processed in suitable software to create the maps and the vegetation indices.
- Interpreting the result. The map is examined together with the look of the crop and the available agronomic data. The aim is to identify the areas that need further checking.
- Using the findings. Depending on the crop and the question, the results can support monitoring of the field or become the basis for planning a prescription map.
Learn more about the FLYDROPS field multispectral imaging service. If you only need field boundaries and areas, see field mapping, and for orchards 3D mapping.
4. What can NDVI offer the grower?
The value of NDVI is not simply that it produces an impressive map. It is that it lets us spot differences, follow how they develop and decide where to focus.
- Early detection of differences. One part of the field may look different from the rest. The map helps identify that difference and plan a check on the ground.
- Following how the crop develops. Repeated measurements at suitable intervals show how vegetation changes through the season. For reliable comparisons it is important to take into account the growth stage, the capture conditions and consistency in processing.
- Better targeting of field checks. Instead of examining the whole area in the same way, the grower can use the map to pick specific spots that deserve a closer look.
- Support for decisions in precision agriculture. When the results are combined with knowledge of the crop and the right agronomic information, they can contribute to better-founded decisions on managing the field.
One example of crop mapping in practice is the study Plant stand count in corn, sunflower and sugar beet.
5. Can NDVI tell us why a plant is not growing properly?
Not by itself. A lower NDVI value does not automatically mean a nitrogen deficiency, an irrigation problem or a disease. A similar picture can come from different causes, such as:
- Differences in the growth stage of the plants.
- Uneven vegetation or plant density.
- Water or other stress.
- Problems related to the soil or the growing conditions.
- Bare soil or weeds in the area being recorded.
That is why the right way to use NDVI is as a tool for finding and investigating, not as a substitute for an agronomic assessment. When an area that differs is found, the next step is to examine it in the field and relate it to the available information.
Two limits worth knowing
Dense vegetation: once the crop fully covers the soil, NDVI shows smaller and smaller differences and the values approach the upper limit, so zones are harder to tell apart. In that case other indices, such as NDRE, help. Rows and trees: in vineyards and orchards, the soil and grass between the rows affect the picture, and the interpretation needs care.
6. From the NDVI map to a prescription map
A next step in precision agriculture is to use mapping data to create management zones or prescription maps. A prescription map can define different application zones and, where the right data and supporting evidence exist, support variable-rate application.
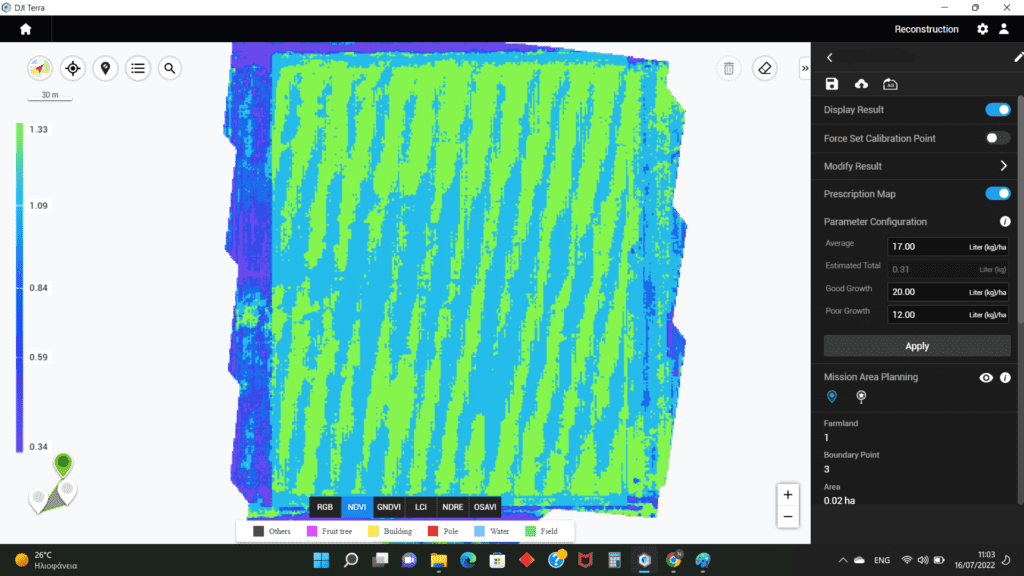
The process is not simply turning the NDVI colours into different product quantities. It needs an assessment of the crop, a defined goal and a sound design of the zones and the rates. One practical example is the study Rice: variable-rate fertilization.
FLYDROPS provides field multispectral imaging and prescription map services to support precision agriculture. See how the Prescription Map service works.
The map does not replace an agronomist’s advice
The map shows zones; it does not choose a product or a rate. The rate and the suitability of a product are decided by the agronomist and the product label. If you are thinking of applying plant protection products with a drone, first see the legal framework in the buying guide: in Greece aerial application is banned as a rule and allowed only with a special permit.
7. When is it worth considering multispectral imaging for your field?
Multispectral mapping can be of interest when:
- You manage large areas and want a better picture of how uneven they are.
- You notice differences in plant growth at different spots.
- You want to compare how the crop develops over successive periods.
- You are considering precision agriculture practices.
- You want to use mapping data to plan management zones or variable-rate maps.
The right result and the value of the analysis depend on the crop, the area, the time the data are captured and the question you want to answer.
Frequently asked questions
What does NDVI stand for?
Normalized Difference Vegetation Index. It is calculated from the light a crop reflects in red and near-infrared, and takes values from −1 to +1.
Which NDVI value counts as good?
There is no single value for all crops. The interpretation depends on the species, the growth stage, the conditions in the field and the date of capture. What usually matters is the differences inside the same field and how they develop over time.
How is an NDVI map different from a drone photo?
An RGB photo shows what the eye sees. An NDVI map also uses near-infrared, which is invisible, and brings out differences in vegetation that an ordinary photo does not show easily.
Can NDVI find disease or a nitrogen deficiency?
Not by itself. It shows where vegetation differs, and the cause has to be checked in the field by the grower or an agronomist.
What drone do I need for NDVI?
A drone with a multispectral camera that records red and near-infrared. One example is the DJI Mavic 3 Multispectral. If you do not want to buy equipment, FLYDROPS does the capture and processing as a service.
Do the time and weather of the flight matter?
Yes, lighting affects the values. For comparable data between different dates you need stable capture conditions and the same way of processing. Ask us about the right timing for your crop.
Is an NDVI map the same as a prescription map?
No. An NDVI map shows vegetation. A prescription map splits the field into application zones, based on the map and an agronomic assessment.
Conclusion: more information for better decisions
NDVI is a useful precision agriculture tool because it helps capture differences in vegetation and direct field monitoring more effectively. It does not replace the grower or the agronomist and does not give all the answers by itself. It can, however, offer an extra source of information on where to focus and which areas are worth investigating.
With multispectral drones, correct data processing and proper evaluation, mapping can become an important part of a more organised approach to crop management.
Want to see what multispectral imaging can offer on your own field?
The FLYDROPS team can tell you about field multispectral imaging, multispectral mapping and the options for creating prescription maps. Tell us which crop you have, where it is and how many hectares you want to look at. Call (+30) 2391 301149 or ask for a quote.
FLYDROPS: together, for smarter farming!
Sources: NASA Earth Observatory, Measuring Vegetation (NDVI & EVI) for the definition and the indicative values, and DJI, Mavic 3 Multispectral specifications. Values depend on the crop and the capture conditions.